Bingo Number Distribution Patterns Across Formats and Impact on Outcomes
Finley Weber · Sep 13, 2026
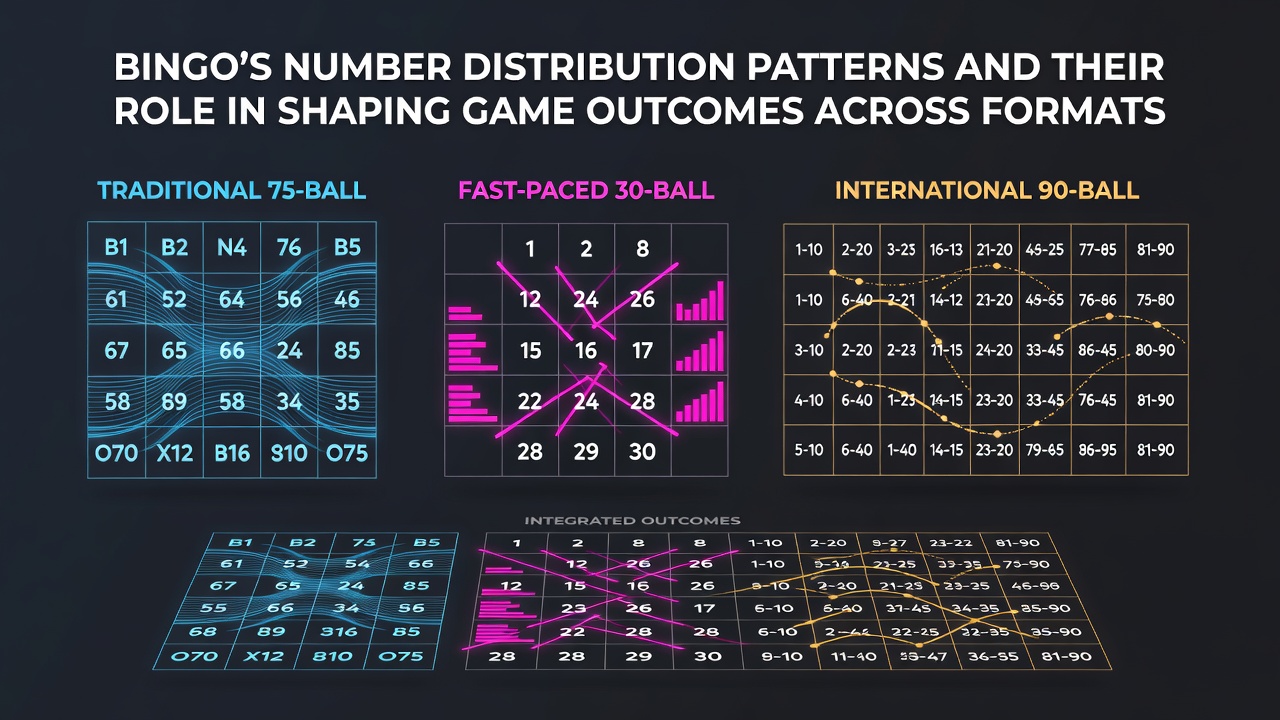
Bingo Number Distribution Patterns Across Formats and Impact on Outcomes
Standard bingo relies on random number generation from fixed pools yet distribution patterns vary by format and influence how games reach completion across 75-ball, 90-ball and other variants. Researchers tracking call sequences note that each number retains equal probability while card layouts and winning requirements create observable clusters in play progression. Data from multiple jurisdictions shows these patterns shape the pace at which players mark cards and achieve required lines or full houses.
Core Mechanics in Major Formats
Seventy-five-ball bingo uses numbers one through seventy-five arranged in five columns labeled B-I-N-G-O with each column holding a fifteen-number range and players need specific patterns such as lines or shapes to win. Ninety-ball bingo draws from one to ninety across three rows and nine columns per ticket with wins progressing through one line, two lines and full house stages. Eighty-ball and other regional variants add further layers where column structures and number groupings alter how frequently certain ranges appear during draws.
Studies of live sessions reveal that column-based restrictions in seventy-five-ball create concentrated calls within fifteen-number blocks while ninety-ball spreads draws across a broader pool and produces slower initial matches for single-line wins. Observers note these structural differences lead to distinct timing for pattern completion even though underlying randomness stays constant.
Statistical Distribution in Practice
Random number generators used in both land-based and digital bingo maintain uniform distribution yet game records indicate clustering occurs around mid-game when multiple cards compete for the same pattern. Analysis of thousands of rounds demonstrates that early calls often cover lower or higher extremes before settling into middle ranges depending on the format's column setup. Figures released by the Nevada Gaming Control Board highlight consistent uniformity across electronic systems while player card density affects perceived streaks.
According to industry reports from the Canadian Gaming Association, operators track draw histories to verify equipment performance and confirm that no format introduces bias beyond layout constraints. These records help explain why certain number groups surface more visibly during peak play hours without altering true odds.
Cross-Format Comparisons and Outcome Timing
Seventy-five-ball games typically conclude faster on average because smaller pools and pattern variety allow quicker matches whereas ninety-ball sessions extend longer due to progressive win stages and larger number sets. Data collected in September 2026 from regulated markets showed similar completion rates across online platforms with adjustments for session volume and player count. Patterns such as four-corner wins in seventy-five-ball or two-line combinations in ninety-ball shift focus toward specific number subsets and alter the distribution of remaining calls.
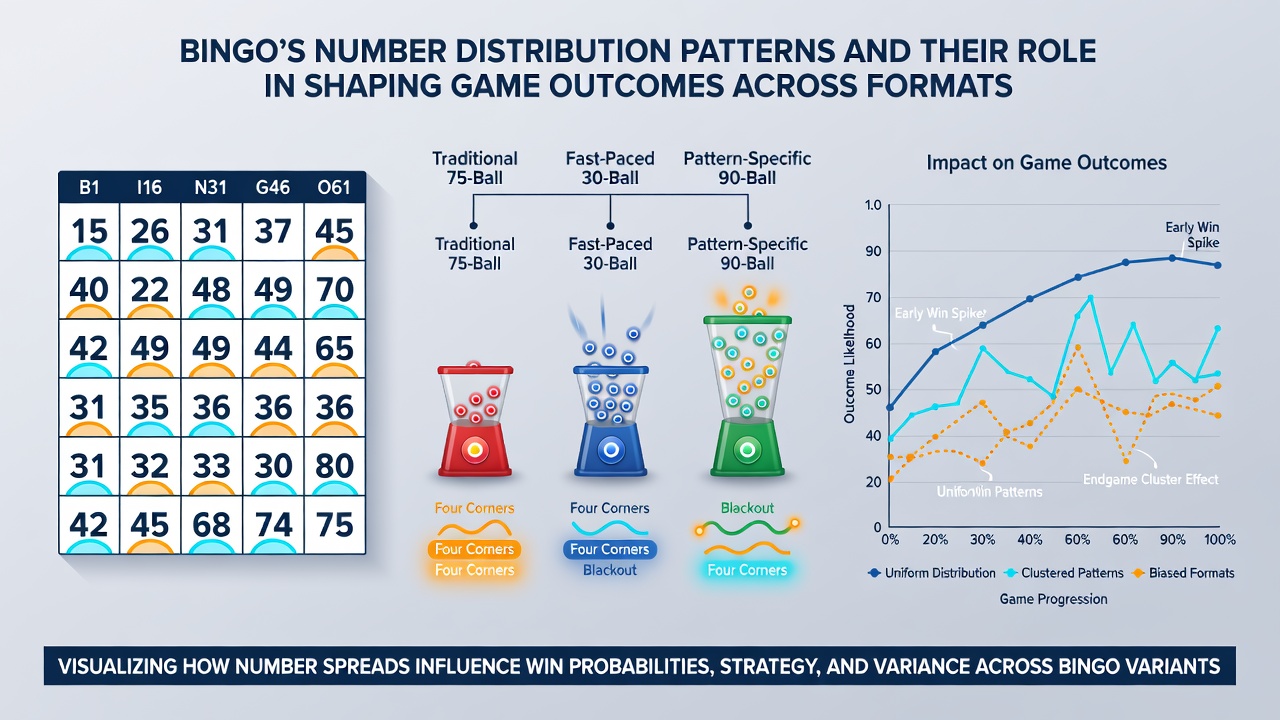
Electronic systems in various regions apply identical randomization standards yet ticket designs create visual groupings that players interpret as streaks. Research from academic gaming studies confirms these groupings stem from card architecture rather than draw mechanics and produce measurable differences in how outcomes unfold across formats.
Regulatory Oversight and Data Tracking
Gaming authorities require verification of random number generators and maintain logs that document distribution consistency over time. Reports from the Queensland Office of Liquor and Gaming Regulation emphasize ongoing audits that separate format-specific patterns from equipment performance. Such tracking allows operators to adjust session parameters while preserving fairness and provides public data on call frequencies across different bingo styles.
Operators integrate these insights into platform design so that number pools and card layouts align with regulatory expectations in each jurisdiction. The result is a framework where distribution patterns remain predictable in structure but random in sequence and support varied game lengths without introducing advantage.
Conclusion
Bingo number distribution patterns arise primarily from format rules and card structures rather than any deviation from randomness. Seventy-five-ball, ninety-ball and related variants each generate distinct call clusters that affect game pacing and win timing while statistical uniformity holds across all systems. Regulatory records and operational data confirm these patterns shape outcomes through layout mechanics alone and continue to guide format development in regulated markets.